Dr. Jose Agraz
para-Hydrogen Induced Polarization (PHIP)
PHIP : LabView Software
Introduction
PHIP is a method that provides a strong enhancement of the MRI signal and allows the acquisition of images from nuclei other than protons. The hyperpolarization of cell metabolites is key to their imaging due to the 30,000 to 100,000 signal amplitude increase after hyperpolarization, but hyperpolarizing a metabolite is not a trivial process. Hyperpolarization of metabolites lead to a number of new challenges. LabVIEW, a high level graphical programming language efficiently adapts to hyperpolarization process challenges and allows for a more natural intuitive man-machine interaction than text based languages. Furthermore, as hyperpolarization of metabolites difficulties arise, LabVIEW’s hardware control versatility and easy to program graphical user interface (GUI), reduce costs associated with the hyperpolarization process automation. In reviewing the literature, no LabVIEW software applications in para-hydrogen induced polarization (PHIP) instrumentation have been published.
LabView Software
The LabVIEW software provides a graphical application development environment developed by NI in 1986 for Apple Macintosh. LabVIEW is composed of several sub-tools targeted at making the development and prototyping of instrumentation applications very simple, flexible, and efficient. This prototype was developed with software flexibility in mind, allowing for easy and intuitive changes to its graphical code.
Signal Acquisition
The signals acquired in this project are; Temperature, Pinch Valve Status, Gases Pressure, and Bo Current. These signals were acquired through two data acquisition boards. First, the NI PCI-6221 with two 16-bit analog outputs and 24 digital I/O lines (Dev1) and the NI PCIe-6351 with 16 analog inputs and 24 digital I/O lines (Dev2). Dev1 controls and acquires data from pinch valve and VCCS controllers. Dev2 controls fan heaters and RF output sequence and acquires gas pressure data. Once the signals were acquired, the data was available to LabVIEW for further analysis and software front panel (SFP) presentation.
Temperature Recording
The hyperpolarization of metabolites is temperature dependent. Thus, every circuit board designed in our lab and installed in the PHIP prototype comes with a temperature sensor. In total, there are six temperature sensors installed throughout the prototype box. In order to minimize signal noise, the temperature data acquired was further processed by LabVIEW using a Butterworth low pass digital filter with a cut off frequency at 100 Hz.
Pinch Valve System
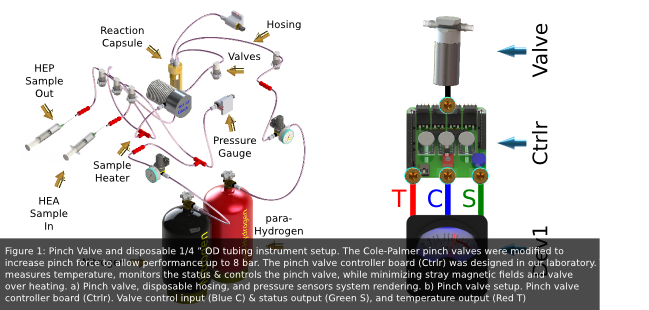
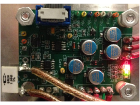
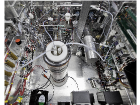
The control of sample and gas flow was accomplished using modified Cole-Palmer 12VDC two-way normally closed solenoid pinch valves. A disposable 1/4"OD tubing was used for the sterile manipulation of gas and sample throughout the system (Fig 1). Each pinch valve was controlled and monitored using Dev1 through a controller circuit designed in our lab. This controller was designed to minimize pinch valve heating and stray magnetic fields.
Gases Pressure Recording
The Honeywell MLH150PGL06B gas pressure sensor was used to monitor nitrogen, hydrogen, and reaction chamber gas pressures. This pressure sensor is an all metal amplified sensor with temperature compensation with a range of 0 bar to 10 bar.
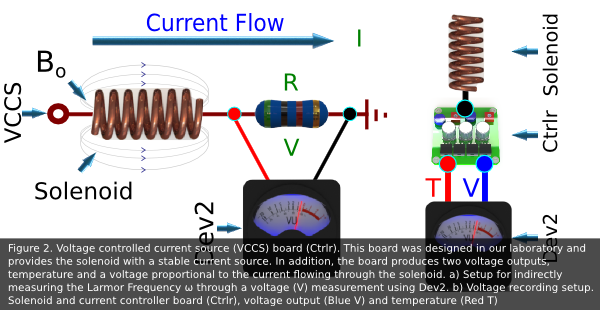
Bo Current Recording
The hyperpolarization of a 13C based metabolite is sensitive to shifts in the
13C resonance frequency, or Larmor Frequency (eq.2.3). Therefore, the monitoring
of the hyperpolarization solenoid’s Bo is of the utmost importance. Exciting a
metabolite sample with an incorrect RF sequence frequency will lead to poor polarization
results. The Larmor Resonance Frequency is measured indirectly through a voltage measurement
provided by a current controller board (designed in our laboratory). Moreover, the voltage
data (V) is collected using Dev2 (Fig 2)
The derivation of the Larmor Frequency is as follows:
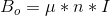
- The current (I) flowing through the solenoid is given by Ohm’s Law
- The solenoid’s Bo is given by eq.2
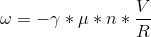
- The 13C Larmor Frequency is given by eq.3
- Inserting eq.2.1 into eq.2.2 and its result into eq.3, leads to the Larmor Resonance Frequency (ω) eq.4

Signal Generation
The signals generated in this project are 1H and 13C sequences. These signals are produced by Dev2’s two 2.86 MS/s analog outputs. The output waveforms are sequences built in advance and stored in technical data management streaming (TDMS) file format for later retrieval. The main program reads these TDMS files and when instructed, sends the data to the output coil encompassing the reaction mix capsule. The TDMS file contains data on the sequence’s sampling rate, waveform amplitudes and length. The sequences shape and length is dictated by the type of hyperpolarizing sequence used (Goldman, Hakee, Kadlecek, etc)
Software Design
In this PHIP instrument prototype, we have used LabVIEW as a platform for acquiring, controlling, and processing data leading to the hyperpolarization of metabolites.
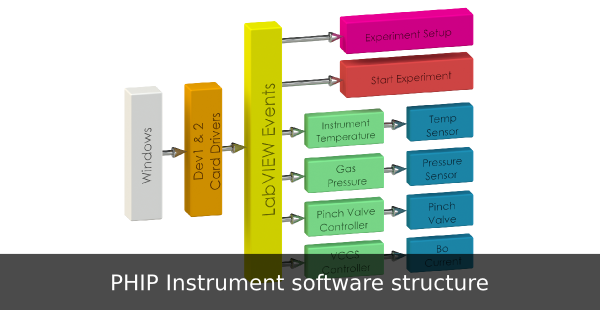
Software Structure
The software structure of the PHIP instrument prototype is shown in fig 3.
With 46 controls and 36 indicators on the SFP, the program is too large for linear
programming. Instead, the program is event driven, allowing for more efficient
program execution. Each button and knob control on the SFP is linked to an
event. When a button or knob is changed by the user, an event is triggered
executing different program sections. If no event is triggered, the event timer
times out at 100ms and collects Gases Pressure, B o Voltage Drop, and instrument
Temperature data. The events available are Start Experiment, individual Pinch
Valve control, and Tab Control Setup. At time out, the following events are
available; Gases Pressure, Bo voltage drop and Instrument Temperature
- Start Experiment event: Simmer time (sample heating), number of line purges, RF sequence execution timing, experiment time range, RF sequence used, and RF feedback.
- Gases Pressure event: The optimal hyperpolarization of a metabolite is dependent (among other parameters) on pressure. Thus, when the event timer times out, the software collects voltage data from pressure sensors connected at the nitrogen (N 2 ) and parahydrogen (p-H 2 ) tanks, and reaction chamber using Dev1. The data is then displayed in a graph on the SFP at a data collection frequency of 10Hz.
- Bo Voltage Drop event: The spin transfer from p-H 2 to 13C nuclei is dependent on exciting the nuclei at the proper Larmor Frequency (ω). Thus, when the software event timer times out, the software collects voltage data from the current controller board designed in our laboratory using Dev2 (fig 2). Then, the software calculates the current through the solenoid, the ω for the given current (eq.3), and displays the results in a graph on the SFP.
- Instrument Temperature event: In order to obtain a precursor full hydrogenation during the hyperpolarization process, the instrument environment temperature needs to be between 40C to 60C. Using Dev1, the software collects data from six different parts in the instrument. Five pinch valve controller boards and a current controller board developed in our laboratory has a temperature sensor. These sensors provide temperature data from inside the instrument box. When the event timer times out, the data is collected and displayed on a graph on the SFP.
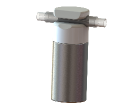
- Hyperpolarization Experiment Software Structure event: A metabolite hyperpolarization experiment begins by heating up the sample and filling up the reaction capsule with p-H 2. Next, the sample is pushed into the reaction capsule and a previously chosen RF sequence applied. Then, the sample is pushed into an external vial and the sample path (lines) is purged (fig 4).
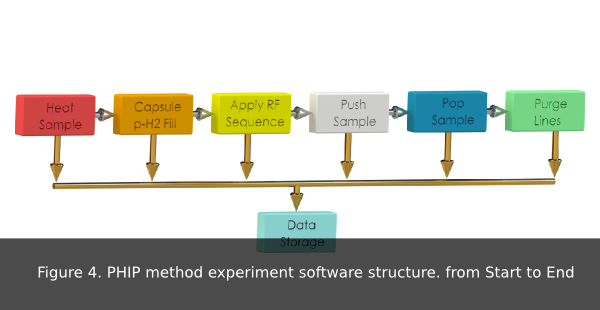
- Heating sample: Heating sample or simmer time. This is the time the sample need to reach proper hyperpolarization temperature.
- Purging Lines: Number of line purges do be done using p-H2 gas after every experiment.
- H2 Gas Fill: The injection of H 2 gas into the reaction capsule for precursor hydrogenation.
- Push Sample: The sample is pushed into the reaction chamber.
- Apply RF Sequence: The RF sequence used to irradiate the sample in the reaction chamber.
- Pop Sample: Once the sample has been polarized, the sample is pushed out of the reaction chamber into a vial.
- Data file: Data on simmering time, pinch valves timing, RF sequence used, gases pressure, B o current, temperature, and number of purges is stored in a TDMS file for later analysis.
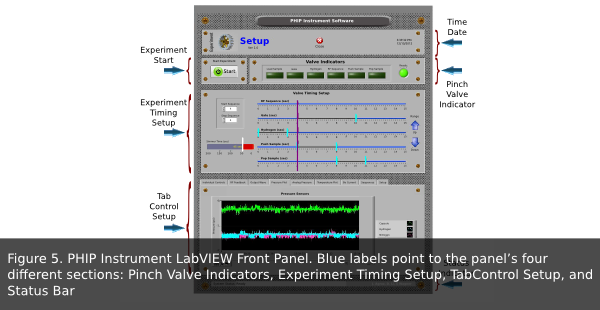
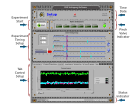
- SFP event: A LabVIEW front panel is composed of controls and indicators. Controls simulate instrument input devices and supply data to the program. Indicators simulate instrument output devices and display data, using either plots or LED’s. The combination of controls and indicators provides the user with an intuitive GUI. This SFP is composed of four sections; Pinch Valve Indicators, Experiment Timing Setup, a series of various controls and indicators in a Tab Control setup, and a System Status Bar (fig 5)
- Pinch Valve Indicators: These indicators display the on/off status of the Pinch valves.
- Experiment Timing Setup: This section contains all the timing controls for the hyperpolarization of a metabolites, such as; sample simmer time, pinch valve switching, RF Sequence start time, number of p-H2 purges, and experiment length.
- Tab Control Setup: This control style is the most efficient way to include a large number of individual controls and indicators in a small space. The Tab Control works by displaying a set of tabs for different sets of controls and indicators. In this case, the Tab Controls consists of nine tabs: Individual Controls-Pinch Valve control, RF Feedback- graphs the RF sequence sent to the reaction capsule, Output Wave- Selects a RF sequence to irradiate a sample, Pressure Plots- Graphs gases pressure, Analog Pressure- Uses dial indicators to show pressure, Temperature Plot- Graphs temperature throughout the instrument, Bo Current-graphs the current flowing through the solenoid, Sequences- Selects the RF sequences to hyperpolarize a sample.
- System Status Bar: This indicator displays the status of the software as a task executes.
 Introduction
 Software
 Bo Control
 Bo Noise
 Pinch Valves
 Conclusions
Feb 14th, 2015 at 5:09 pm